
Slabline™
Graded-card protection score
Slabline™The Baseball index is up 7.42% over this period, -1.32% in the last 7 days against -7.06% over 30. It sits 7.58% below the period high (97 on Sep 13) and 10.27% above the period low (Nov 6).
Gains for the period are intact but the latest week is soft — a pause rather than a reversal unless the low gives way.
Arithmetic over the index level series (7/30-day change, daily volatility, drawdown, distance from the period high and low). Not investment advice.
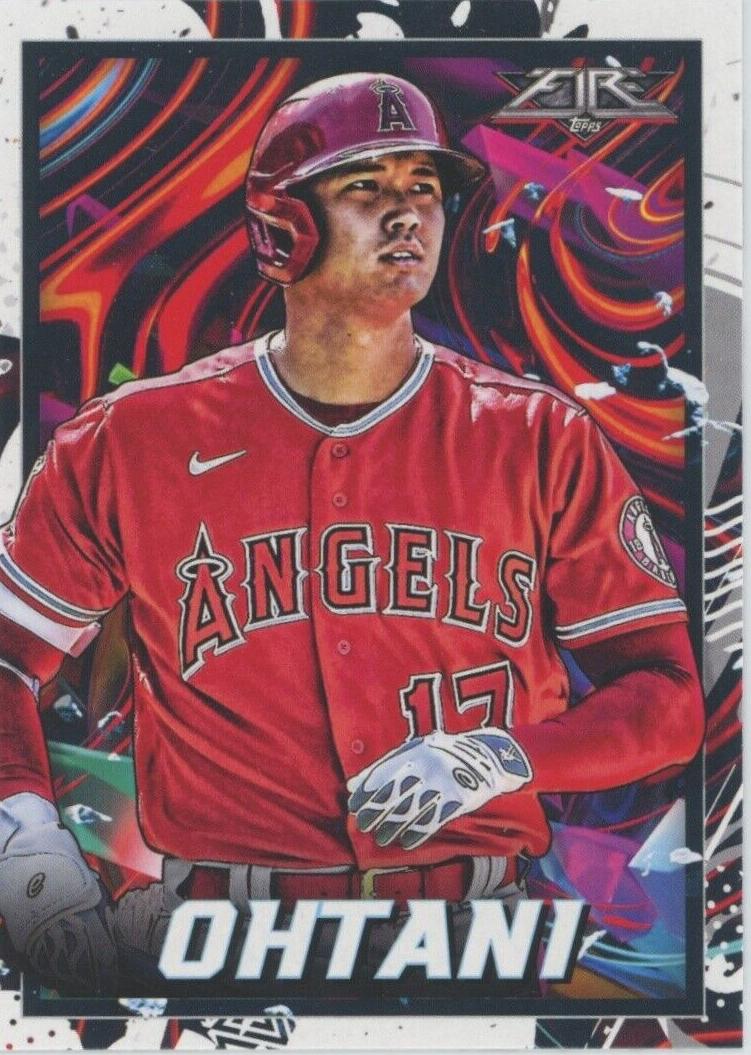 2022 Shohei Ohtani PSA 10Topps Fire · $95+299.44%
 1985 Nolan Ryan PSA 10Topps Tiffany · $2,246+299.15%
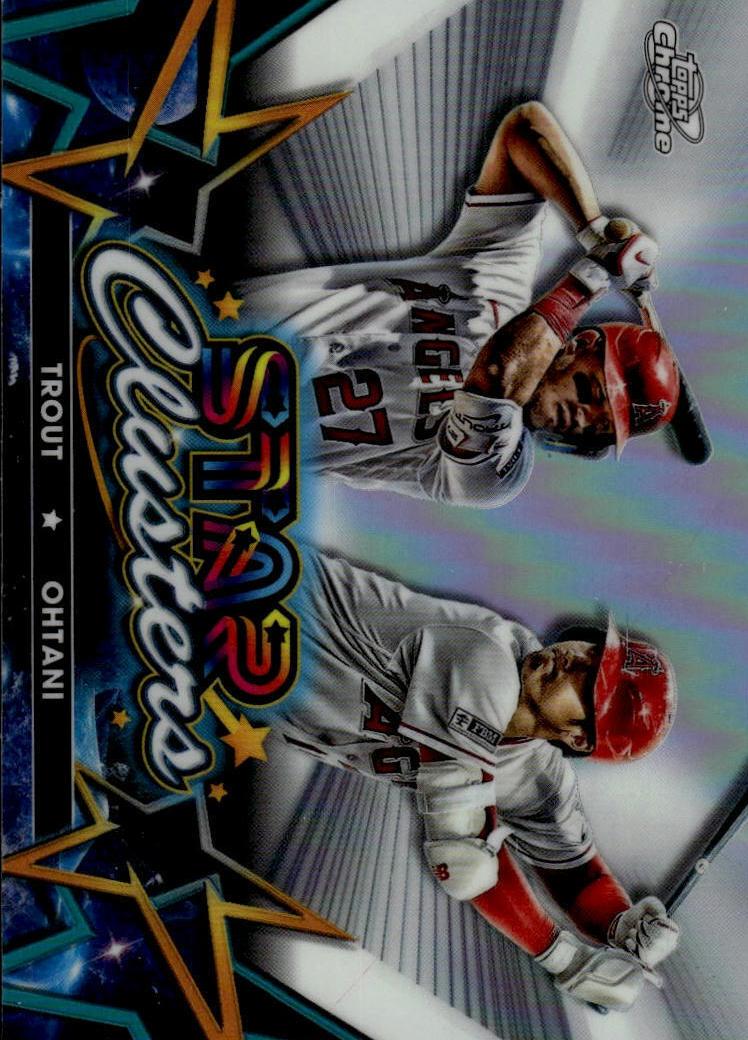 2023 Mike Trout PSA 10Topps Cosmic Chrome · $114+298.90%
 2018 Shohei Ohtani PSA 10Topps Chrome Update · $950+298.15%
 2018 Shohei Ohtani PSA 10Topps Now · $443+297.64%
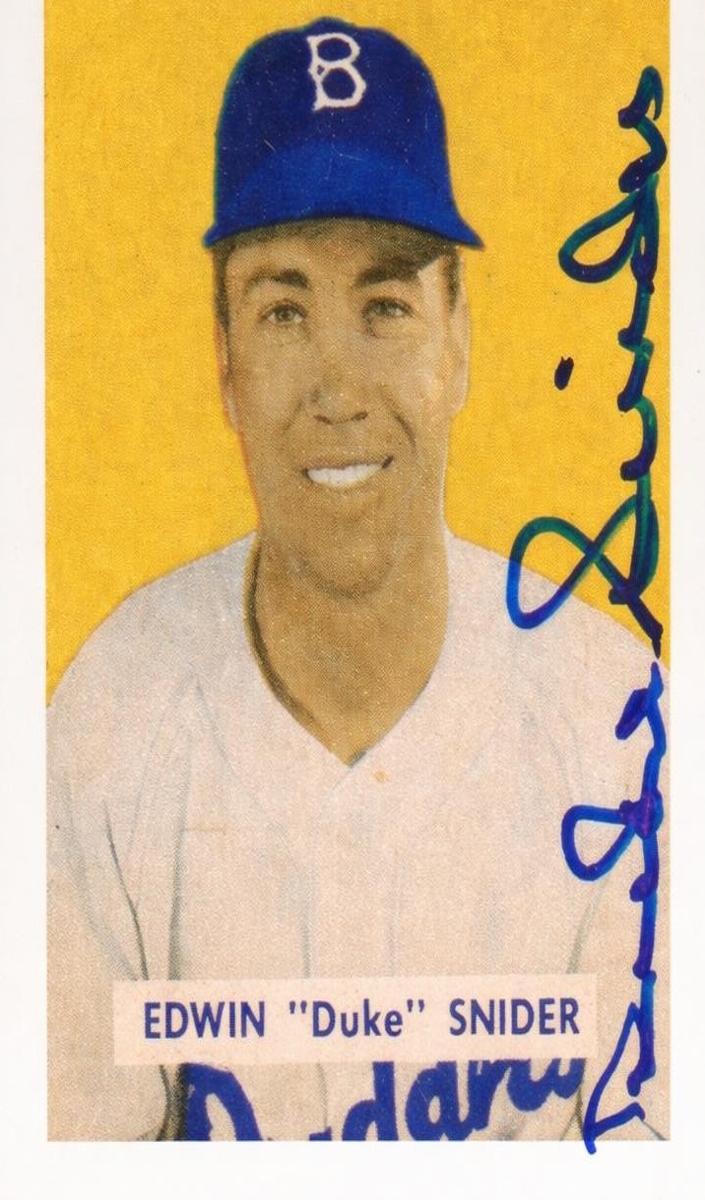 1949 Duke Snider PSA 10Bowman · $8,058+296.95%
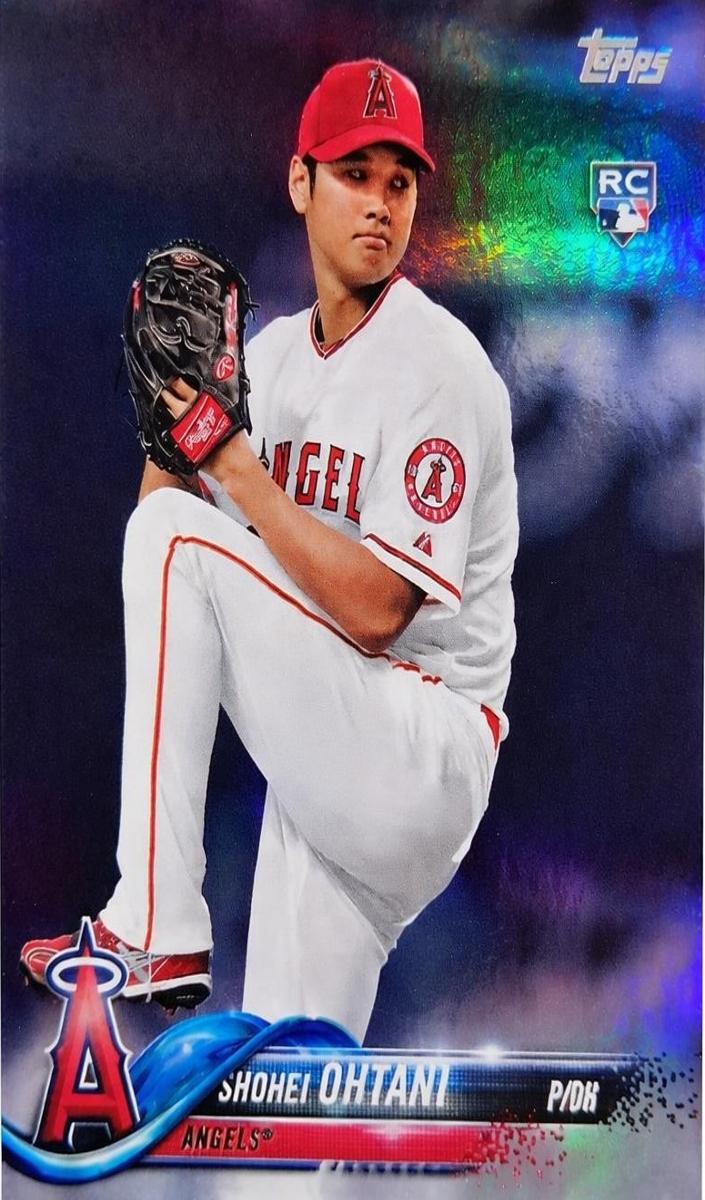 2018 Shohei Ohtani [Rainbow Foil] PSA 10Topps · $2,425+296.71%
 2025 Shohei Ohtani PSA 10Bowman Anime · $8,804+296.49%
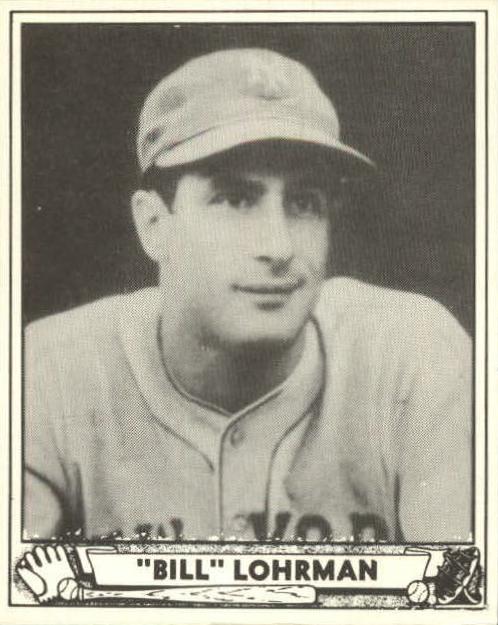 1940 Bill Lohrman PSA 10Play Ball · $4,706+296.10%
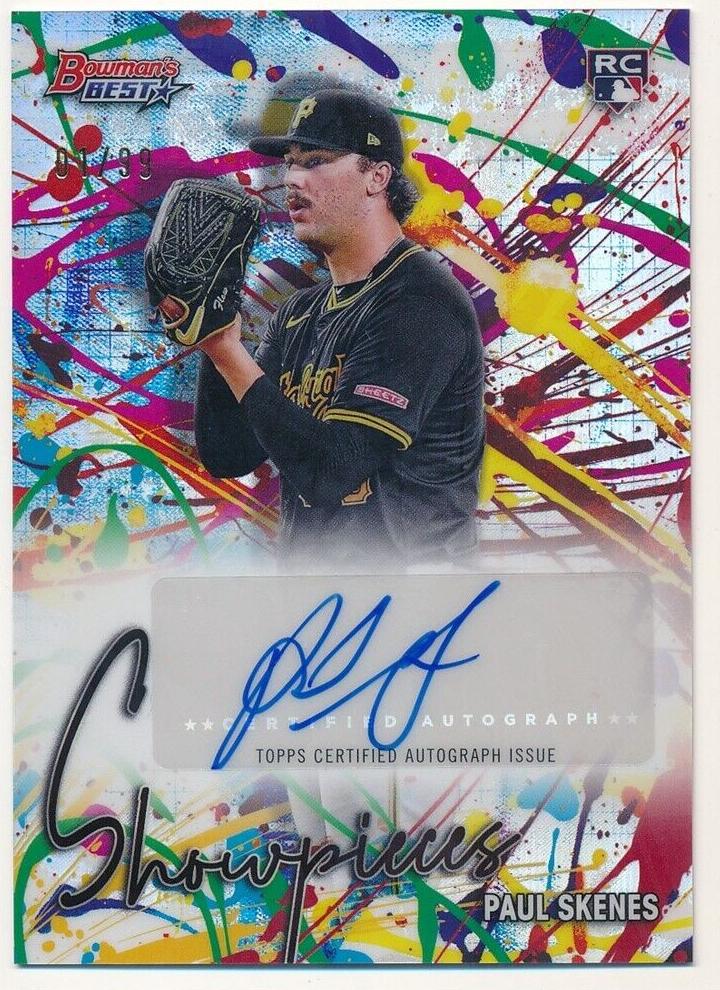 2024 Paul Skenes PSA 10Bowman's Best · $1,075-74.48%
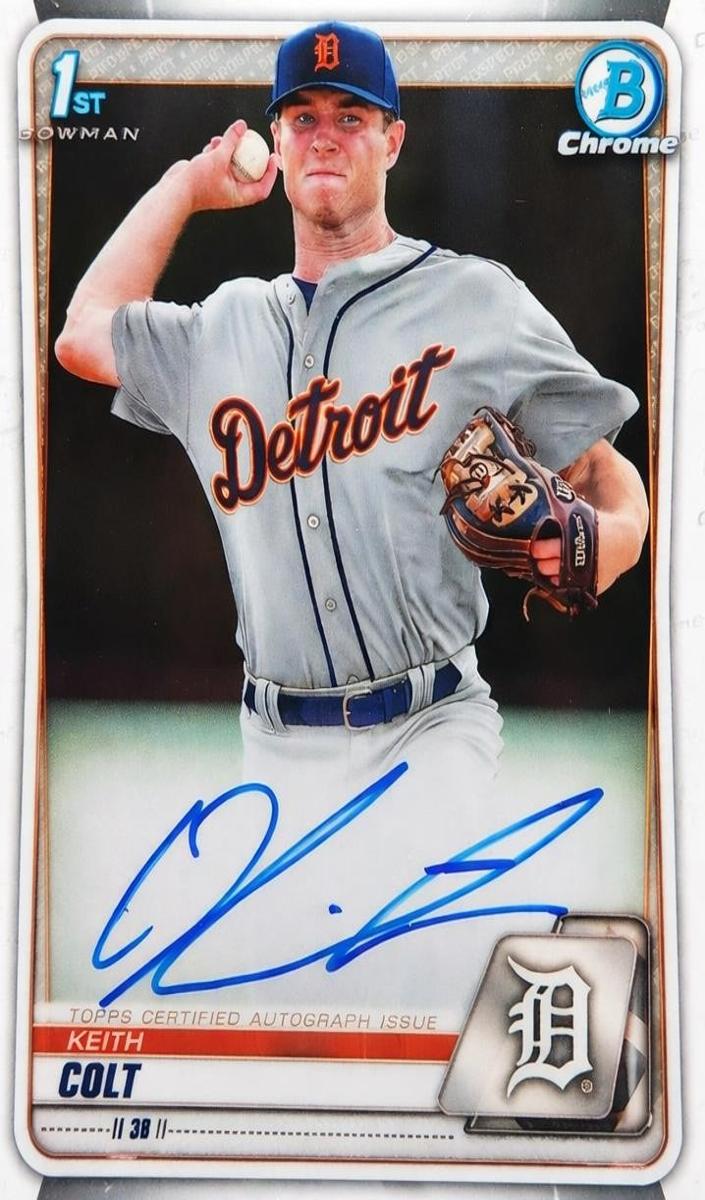 2020 Keith Colt PSA 10Bowman Draft Chrome · $155-74.06%
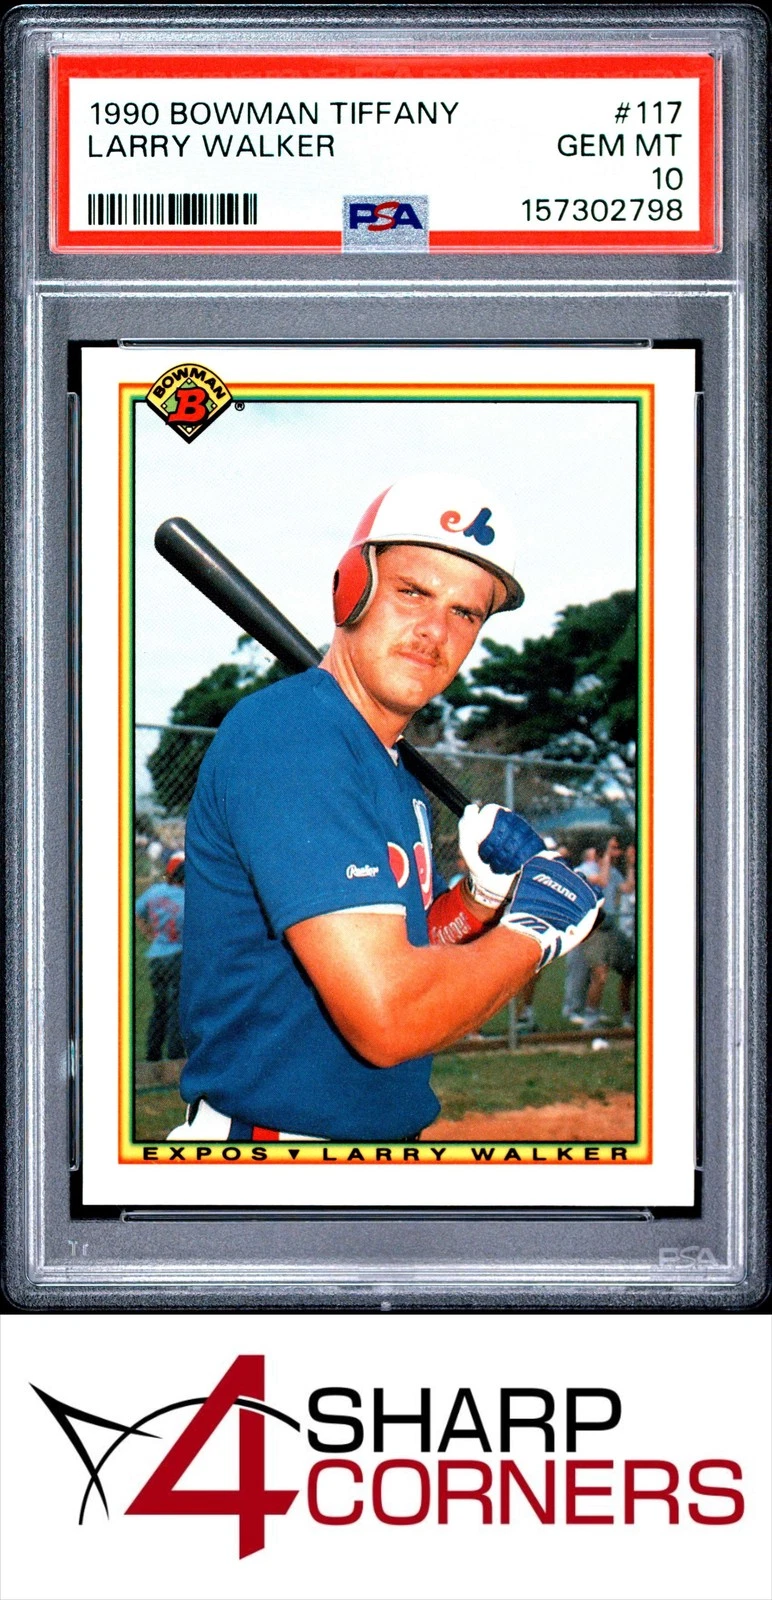 1990 Larry Walker PSA 10Bowman Tiffany · $70-73.79%
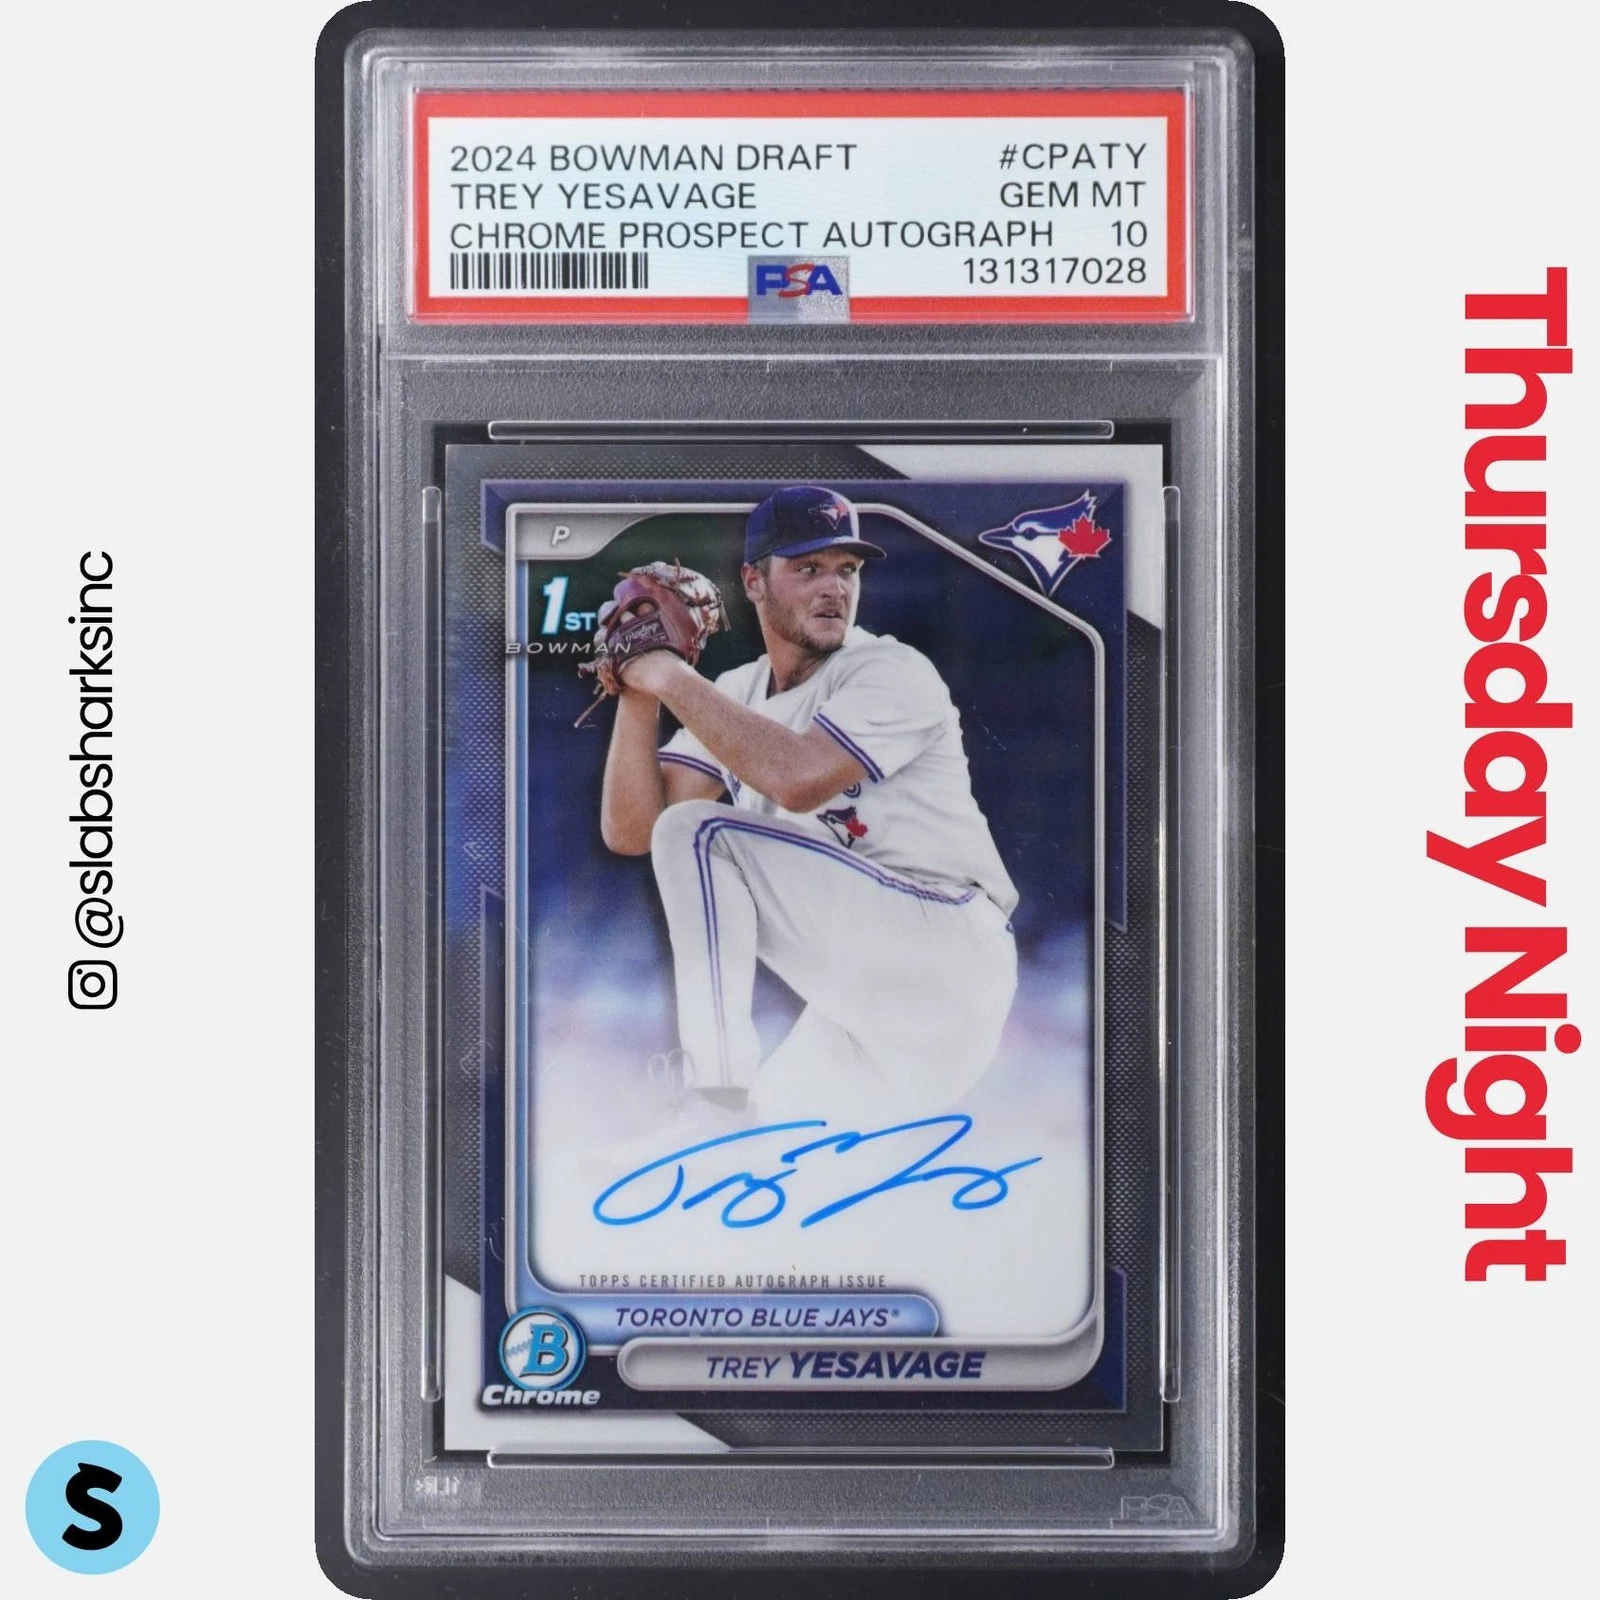 2024 Trey Yesavage PSA 10Bowman Draft Chrome Prospect Autograph · $276-73.67%
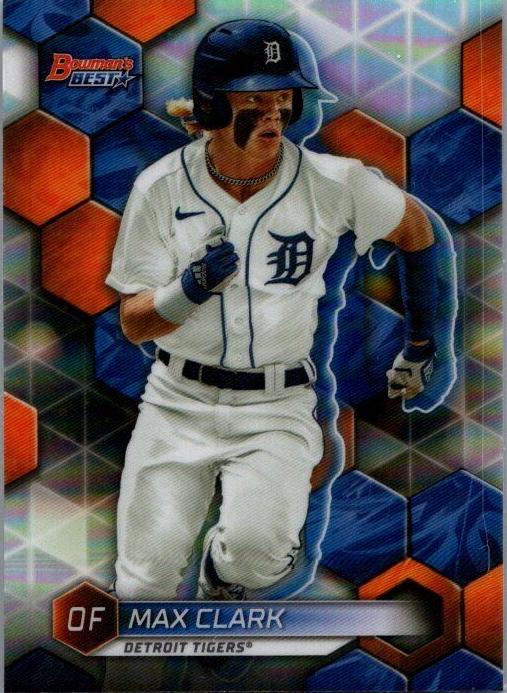 2023 Max Clark [Refractor] PSA 10Bowman's Best · $35-73.66%
 2022 Shohei Ohtani PSA 10Stadium Club Chrome Beam Team · $220-73.42%
 2013 Aaron Judge PSA 10Bowman Chrome Draft Picks & Prospects · $305-73.34%2022 James Wood PSA 10Bowman Chrome Sapphire Autographs · $285-73.28%
 1987 Barry Larkin PSA 10Topps · $51-73.26%
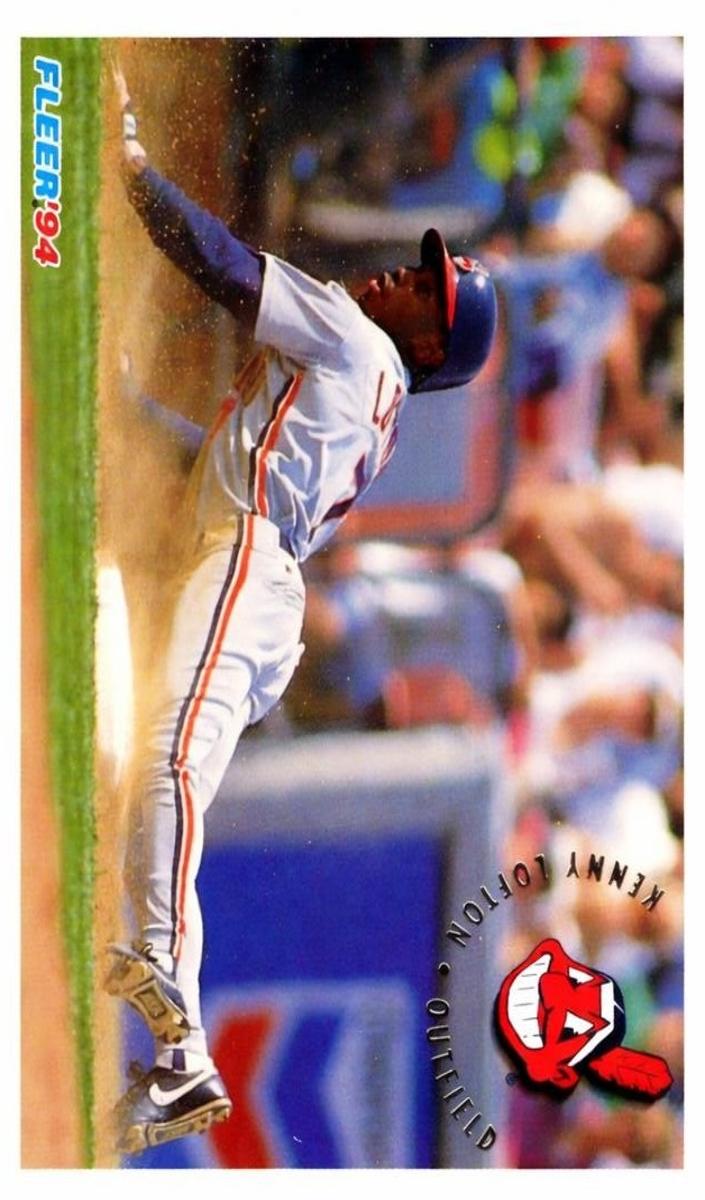 1994 Kenny Lofton PSA 10Fleer · $62-73.20%
Value-weighted index, base 100 at the window start: the sum of the basket's observed values against the prior day's, chained daily, each card's move capped so one outlier can't dominate. Values come from real comparable sales resolved on Slabline card pages. The window deepens automatically as history accumulates. Long-run history reflects the 23,455 most-traded cards in this basket; the recent window covers all 240,888 tracked cards. Not investment advice.
Track them against this index — live values, a 0–1000 protection score, and a broker-ready insurance schedule. Free.