Slabline™
Graded-card protection score
Slabline™The Golf index is up 26.91% over this period, -4.76% in the last 7 days against -5.45% over 30. It sits 5.88% below the period high (121 on Sep 3) and 32.56% above the period low (Nov 21).
Gains for the period are intact but the latest week is soft — a pause rather than a reversal unless the low gives way.
Arithmetic over the index level series (7/30-day change, daily volatility, drawdown, distance from the period high and low). Not investment advice.
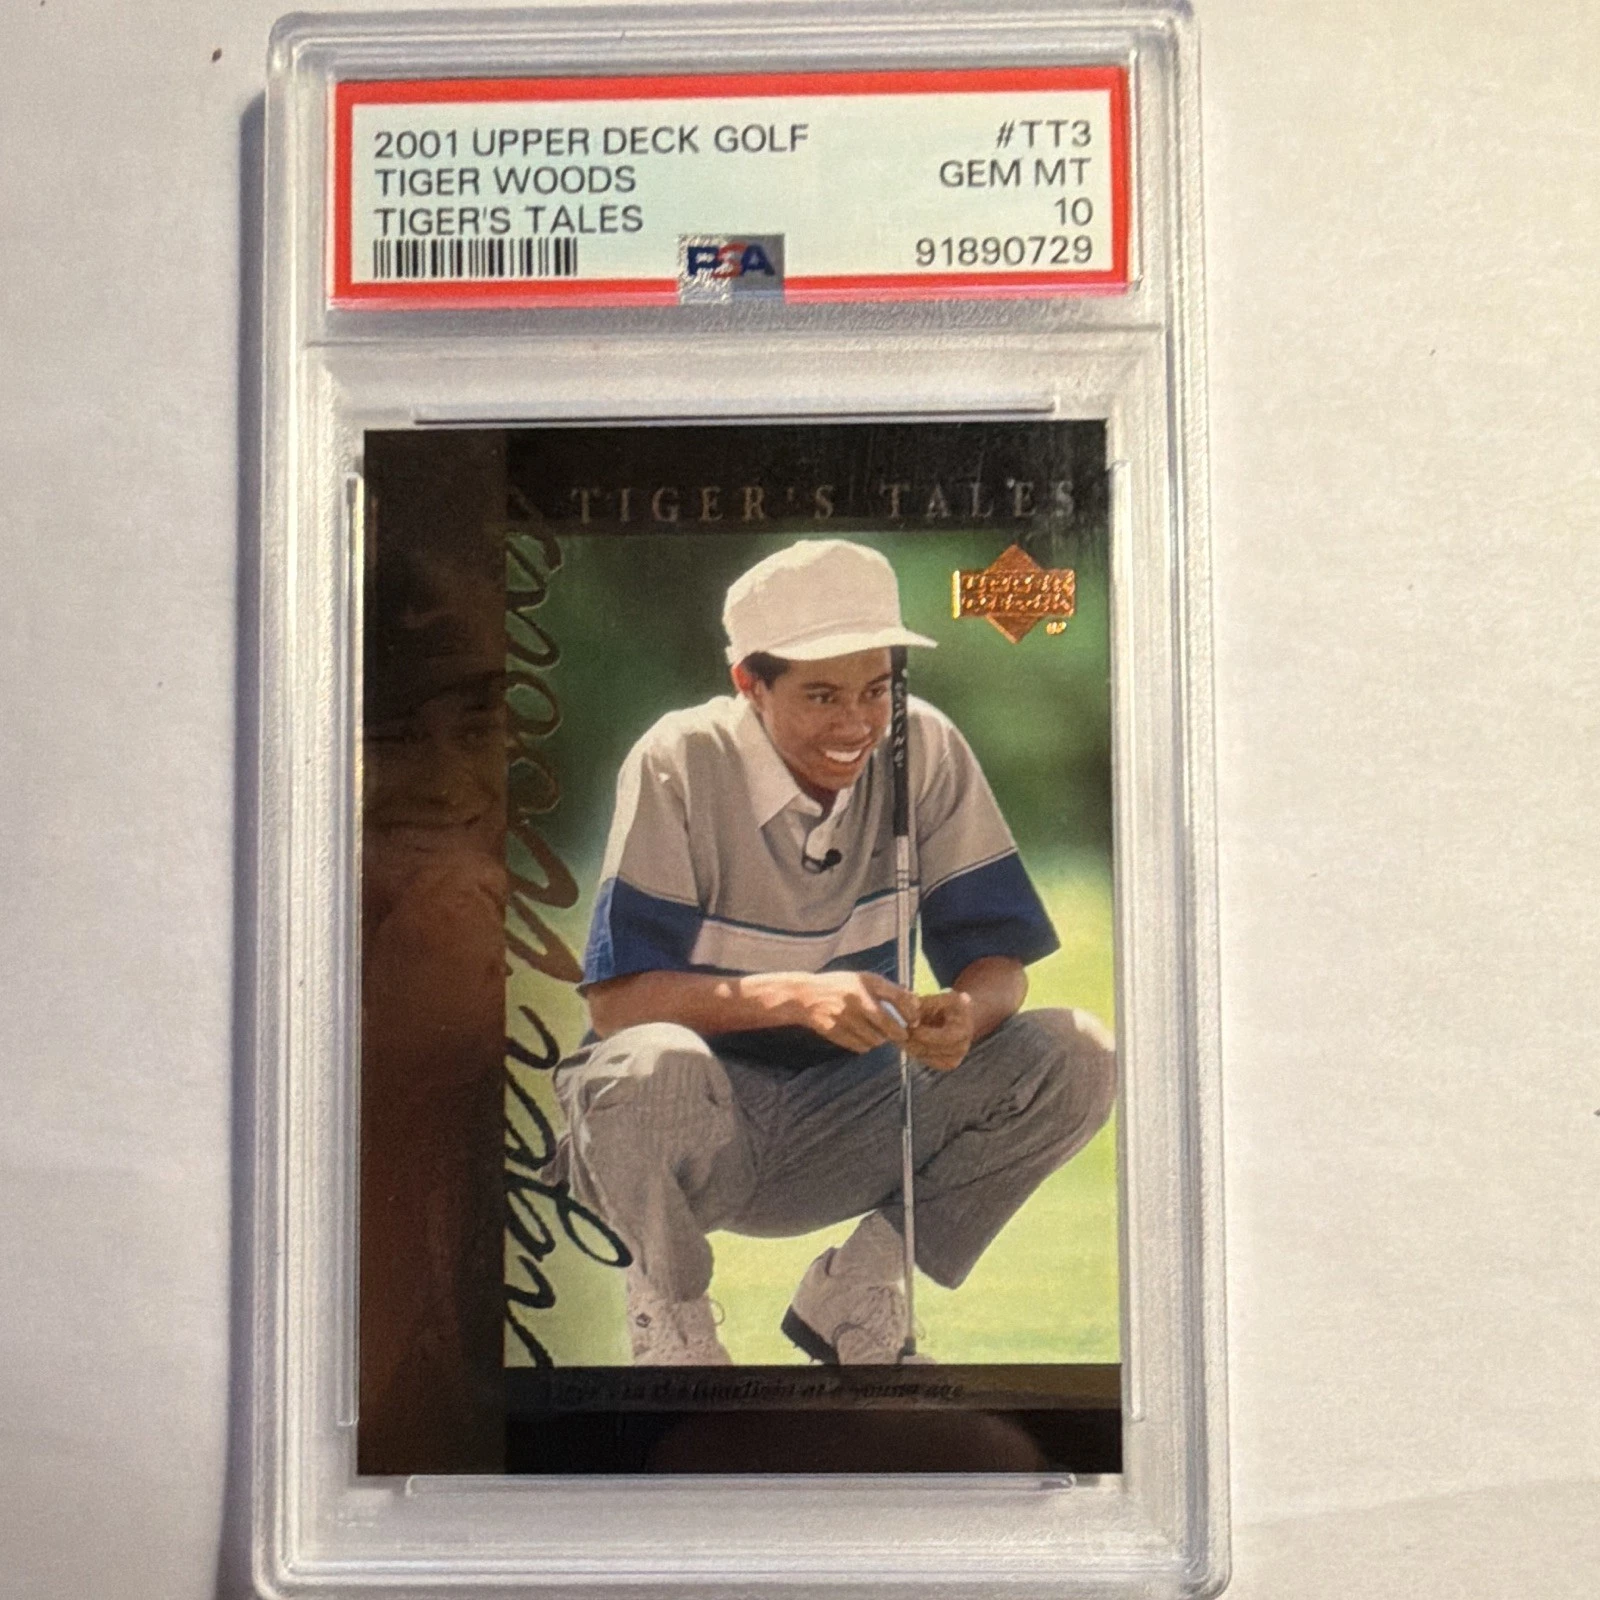
 2001 Tiger Woods PSA 10Upper Deck Tiger's Tales · $89+138.40%
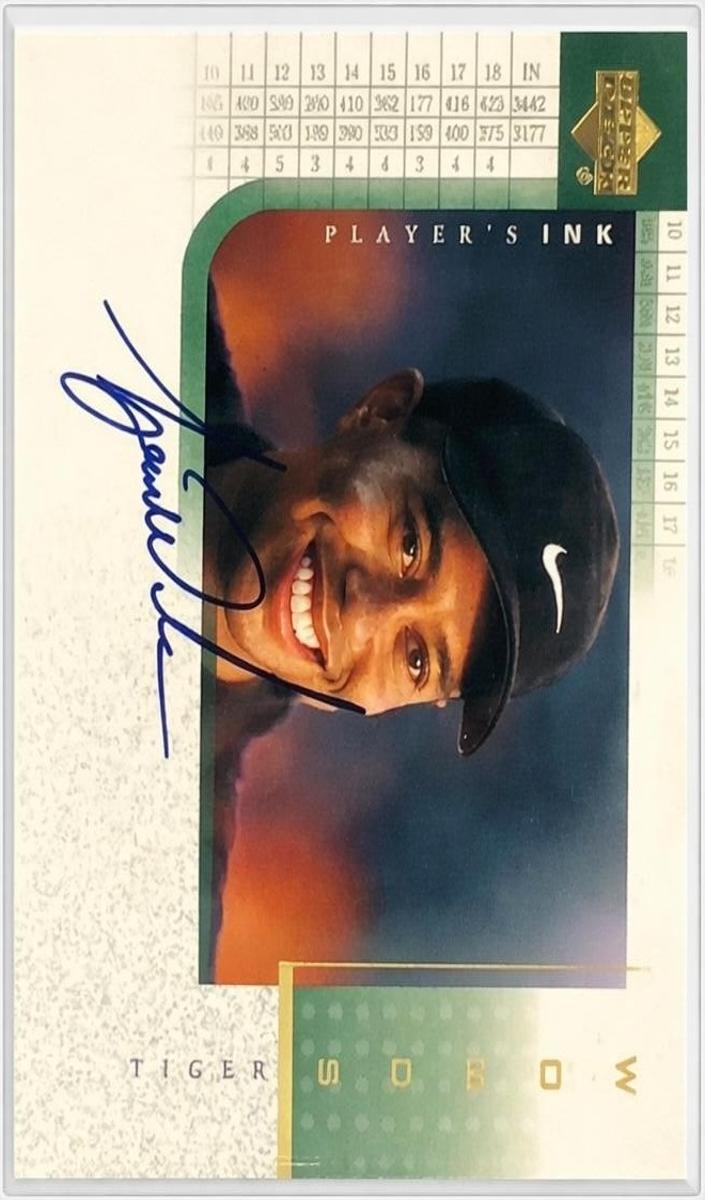 2001 Tiger Woods PSA 10Upper Deck Player's Ink · $12,500+65.65%
 2001 Tiger Woods PSA 10Upper Deck · $384+41.15%
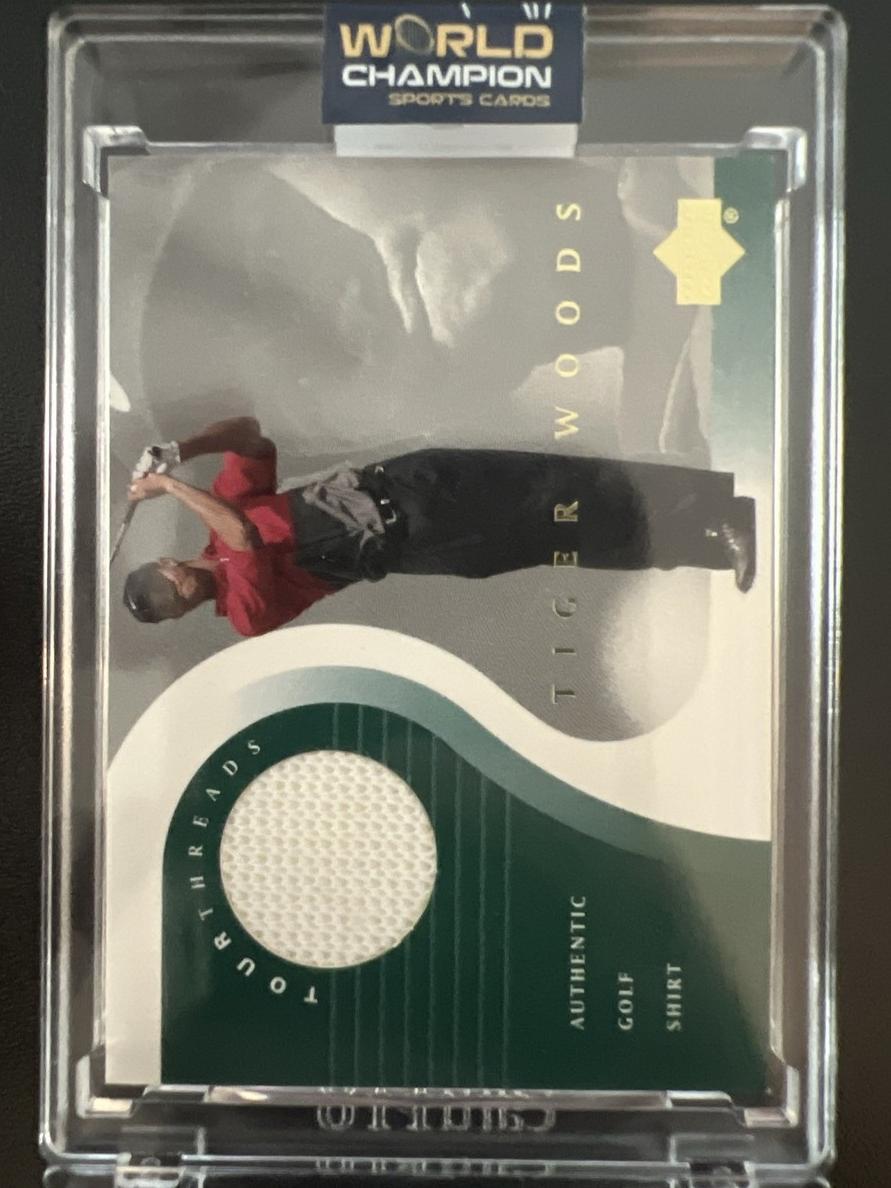 2001 Tiger Woods PSA 10Upper Deck Tour Threads · $2,000+34.11%
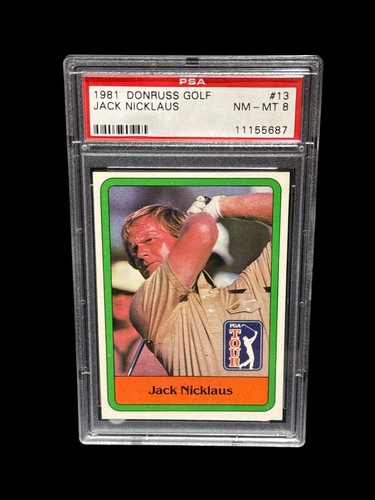 1981 Jack Nicklaus PSA 10Donruss · $3,999+23.05%
 2014 Tiger Woods PSA 10SP Authentic · $500+19.66%
 1996 Tiger Woods PSA 9Sports Illustrated for Kids · $2,850+16.47%
 2001 Tiger Woods PSA 10Upper Deck Stat Leaders · $70+5.98%
 2001 Tiger Woods PSA 10Upper Deck · $90+3.72%
Value-weighted index, base 100 at the window start: the sum of the basket's observed values against the prior day's, chained daily, each card's move capped so one outlier can't dominate. Values come from real comparable sales resolved on Slabline card pages. The window deepens automatically as history accumulates. Long-run history reflects the 27 most-traded cards in this basket; the recent window covers all 1,932 tracked cards. Not investment advice.
Track them against this index — live values, a 0–1000 protection score, and a broker-ready insurance schedule. Free.