
Slabline™
Graded-card protection score
Slabline™The Lou Gehrig index is down 11.57% over this period, -6.15% in the last 7 days against -11.61% over 30. It sits 14.92% below the period high (133 on Sep 22) and 0.03% above the period low (Oct 10).
Downtrend in place; until the 7-day move turns positive, expect the low to be retested.
Arithmetic over the index level series (7/30-day change, daily volatility, drawdown, distance from the period high and low). Not investment advice.
 2022 Lou Gehrig PSA 10Stadium Club · $64+91.47%
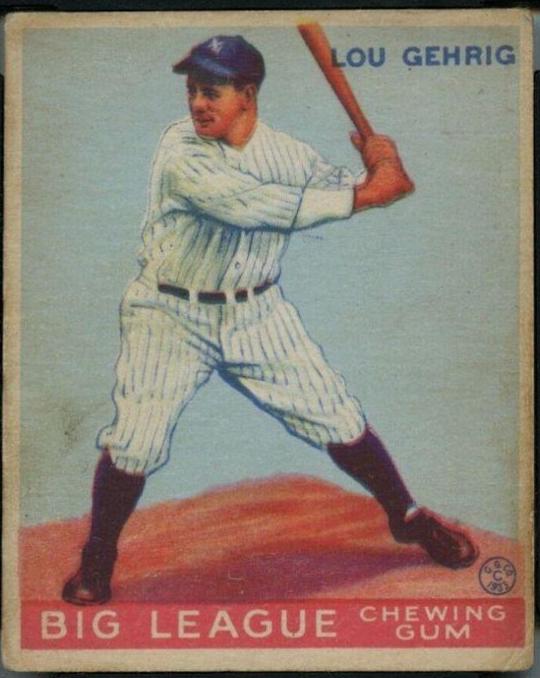 1933 Lou Gehrig PSA 3R319 Goudey · $9,900+81.93%
 1933 Lou Gehrig PSA 3Goudey · $4,486+50.08%1933 Lou Gehrig PSA 4Goudey · $4,486+50.08%
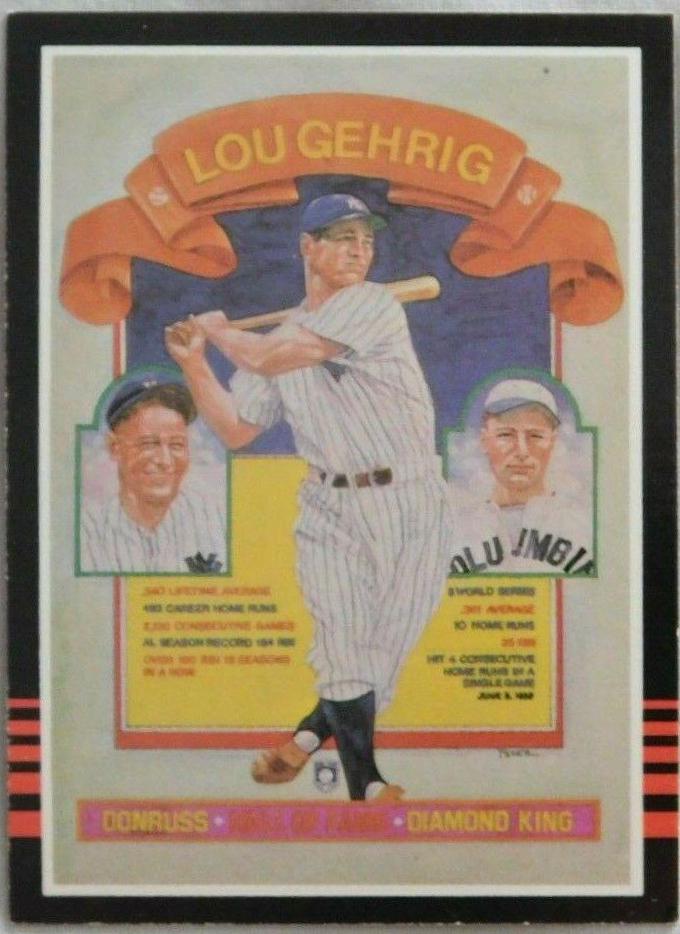 1985 Lou Gehrig PSA 10Donruss · $70+23.69%
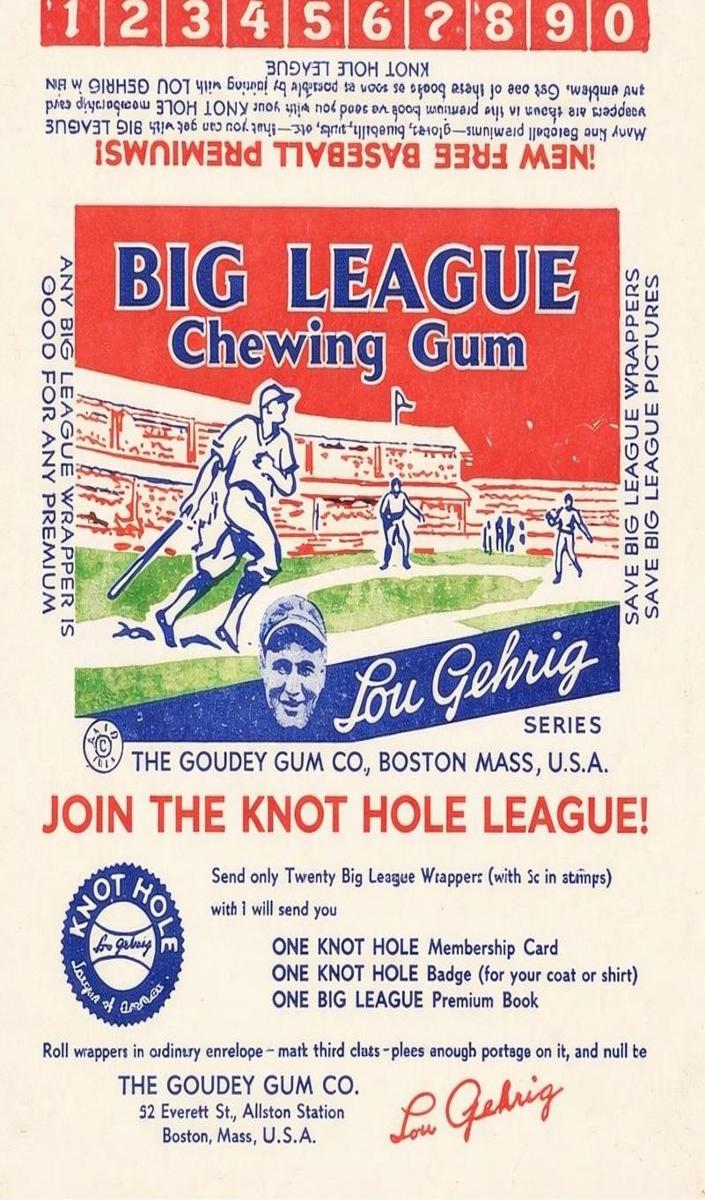 1934 Lou Gehrig SGC 1R320 Goudey · $2,739+21.75%
 1933 Lou Gehrig PSA 1Goudey · $3,399+13.30%
 1933 Lou Gehrig PSA 10Goudey · $1,538,158+13.11%
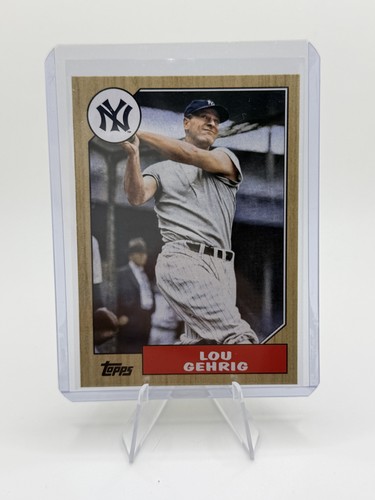 2022 Lou Gehrig PSA 10Topps Archives · $67+12.61%1934 Lou Gehrig SGC 1.5Goudey · $3,317+10.65%
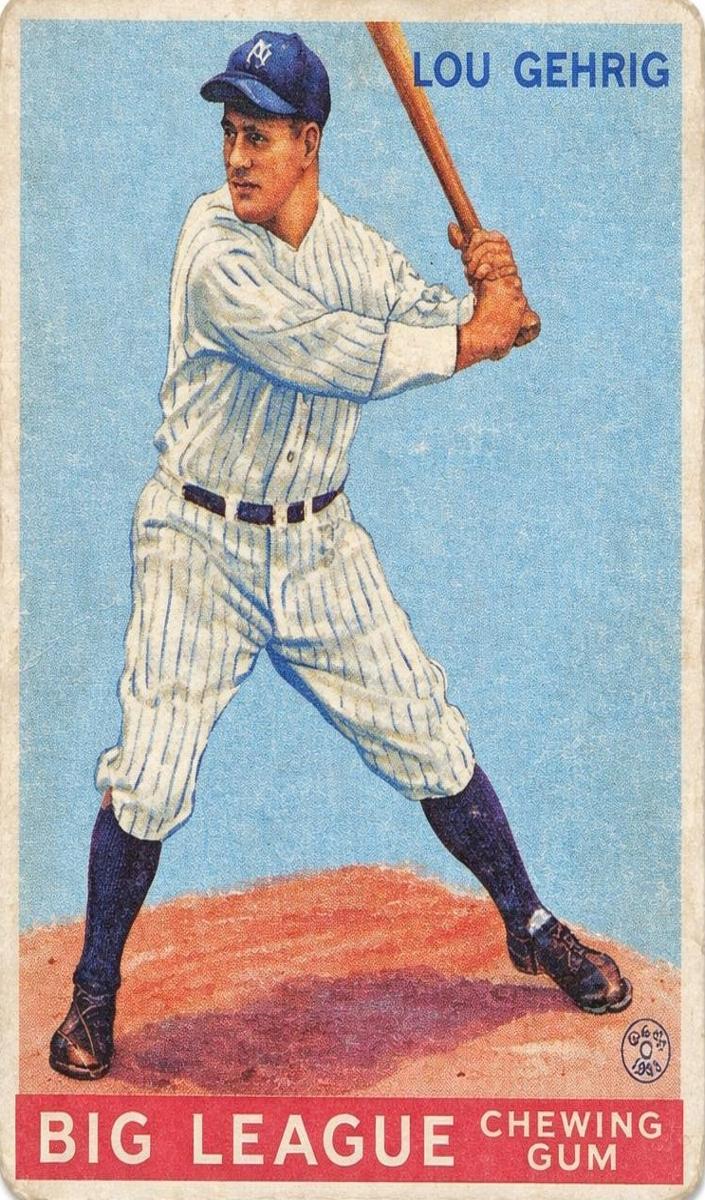 1933 Lou Gehrig SGC 5R319 Goudey · $3,826-72.96%
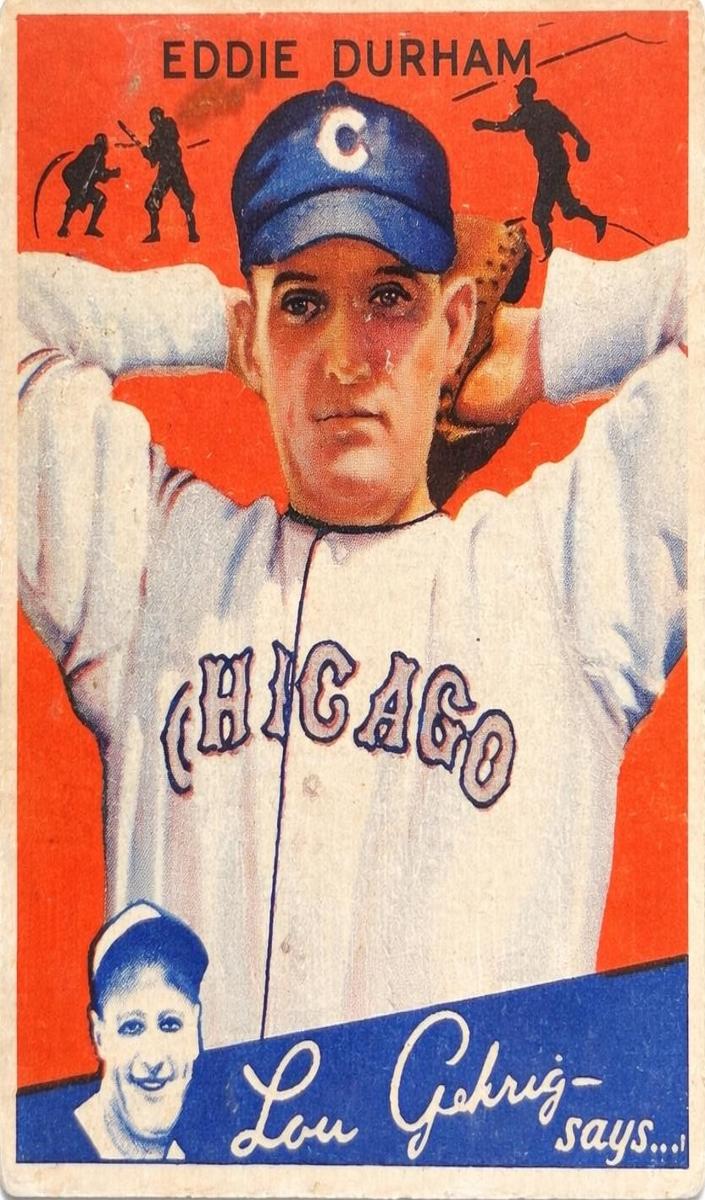 1934 Lou Gehrig PSA 8R320 Goudey · $3,637-69.67%
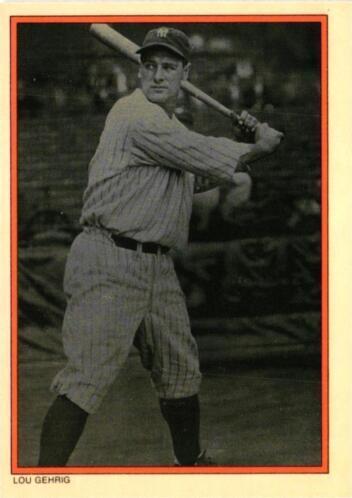 1985 Lou Gehrig PSA 10Circle K · $84-61.52%
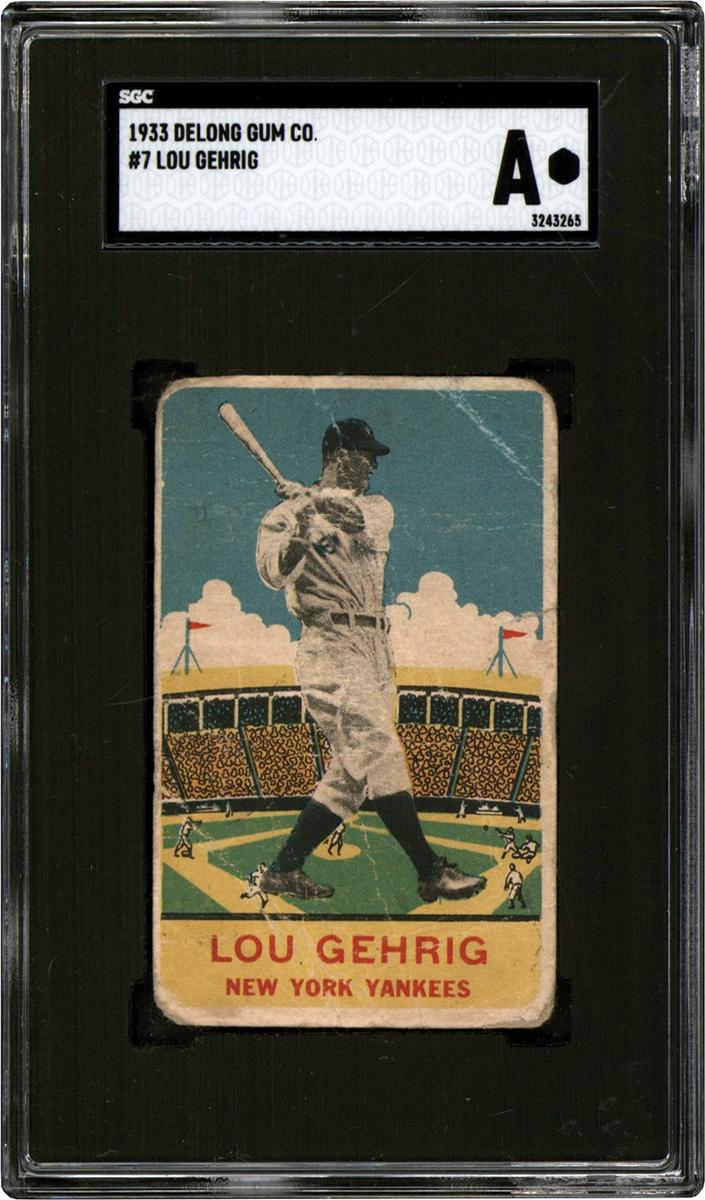 1933 Lou Gehrig PSA 6Delong · $10,155-52.16%
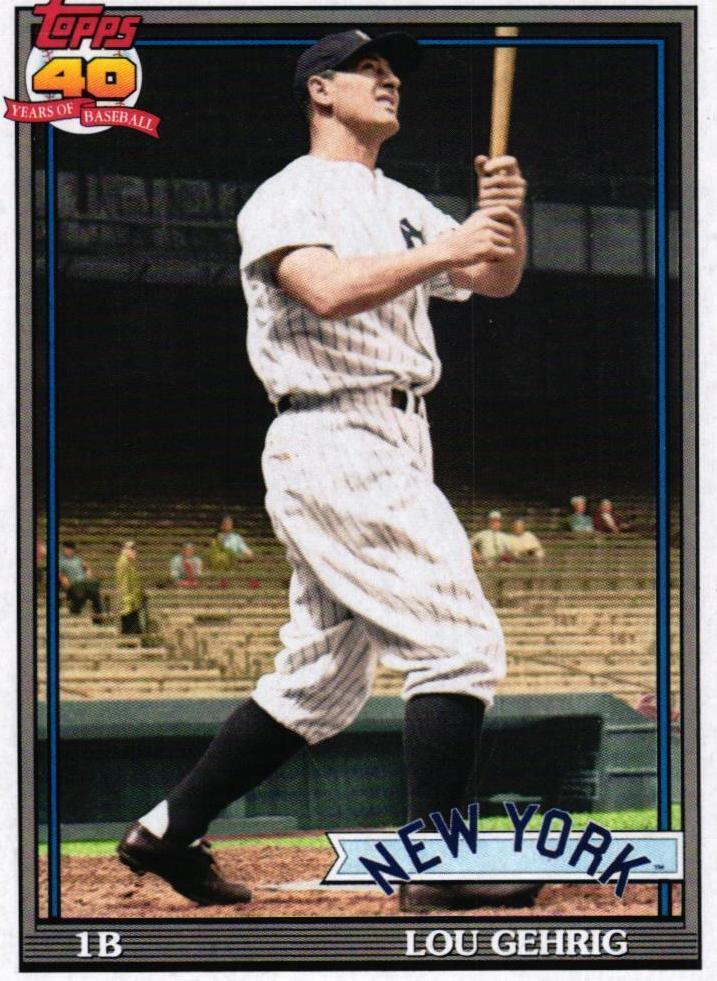 2021 Lou Gehrig PSA 10Topps Archives · $40-30.42%1934 Lou Gehrig PSA 10Goudey · $1,128,681-22.68%
 2020 Lou Gehrig PSA 10Topps Allen & Ginter · $26-20.17%
 1961 Lou Gehrig PSA 10Fleer · $4,576-16.38%1934 Lou Gehrig PSA 10Goudey · $883,211-15.75%1933 Lou Gehrig PSA 2R319 Goudey · $4,486-15.03%
Value-weighted index, base 100 at the window start: the sum of the basket's observed values against the prior day's, chained daily, each card's move capped so one outlier can't dominate. Values come from real comparable sales resolved on Slabline card pages. The window deepens automatically as history accumulates. Long-run history reflects the 78 most-traded cards in this basket; the recent window covers all 217 tracked cards. Not investment advice.
Track them against this index — live values, a 0–1000 protection score, and a broker-ready insurance schedule. Free.