
Slabline™
Graded-card protection score
Slabline™The Marvel index is up 16.03% over this period, -1.97% in the last 7 days against -3.54% over 30. It sits 12.34% below the period high (79 on Aug 21) and 16.16% above the period low (Oct 14).
Gains for the period are intact but the latest week is soft — a pause rather than a reversal unless the low gives way.
Arithmetic over the index level series (7/30-day change, daily volatility, drawdown, distance from the period high and low). Not investment advice.
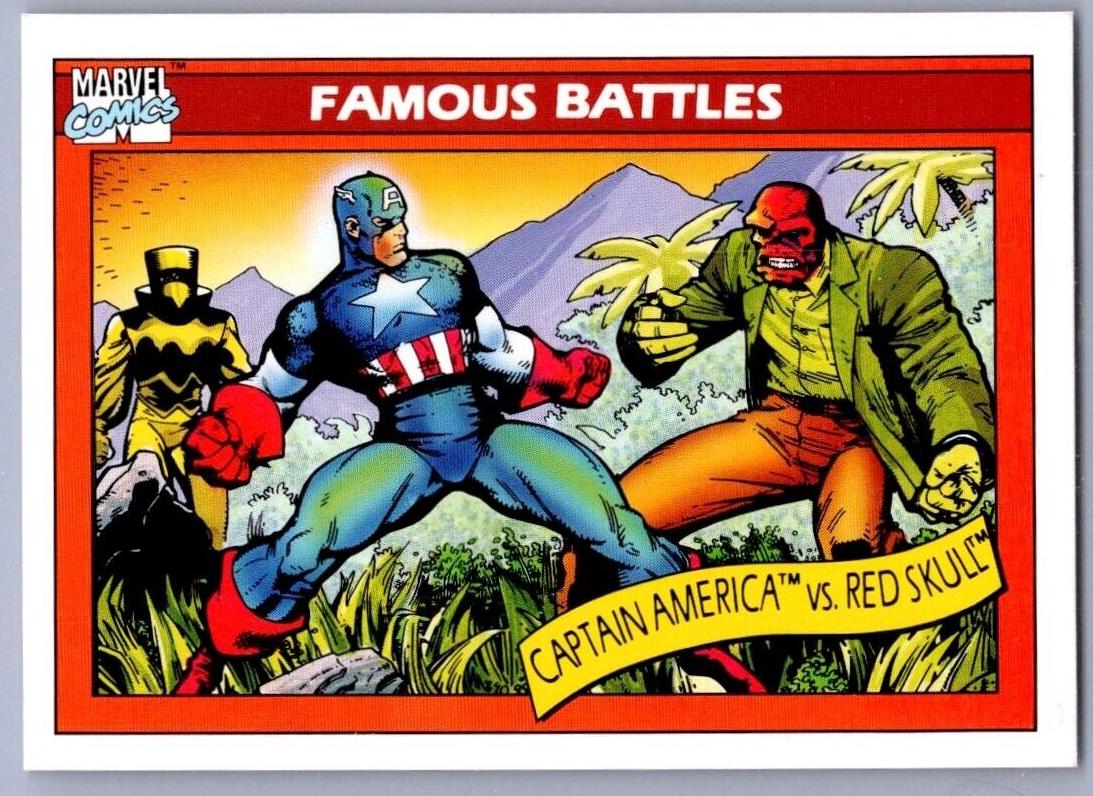 1990 Captain America PSA 10Impel Marvel Universe · $115+285.42%
 1992 Dr. Doom PSA 10Masterpieces · $285+271.47%
 1990 Wolverine [Hologram] PSA 10Universe · $11,230+265.26%
 1991 Silver Sable PSA 10Universe · $470+261.57%
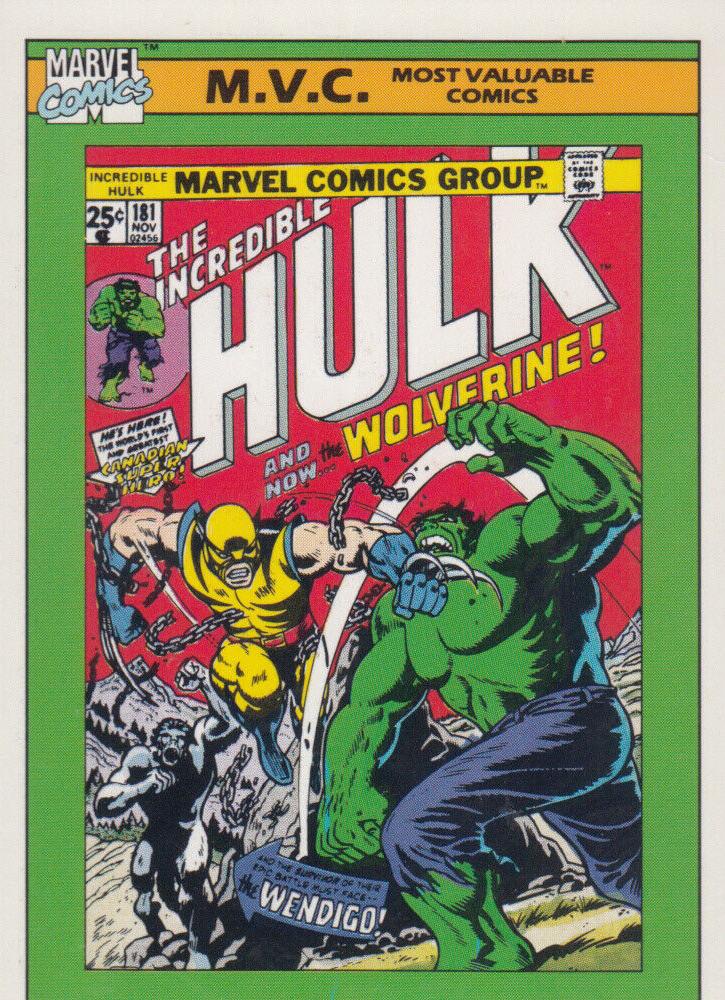 1990 Hulk PSA 10Impel Marvel Universe · $175+240.90%
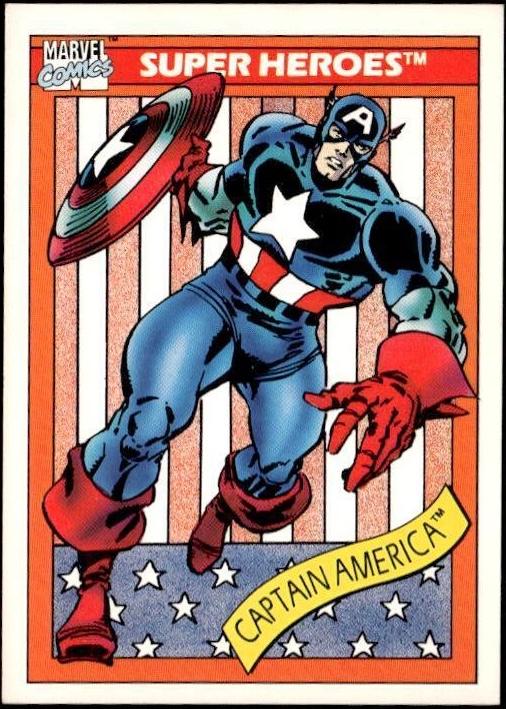 1990 Captain America PSA 10Universe · $300+233.33%
 1990 Stan Lee PSA 10Impel Marvel Universe · $395+229.10%
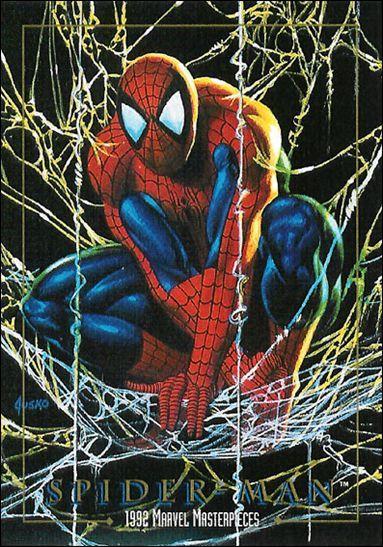 1992 Spider-Man PSA 10Masterpieces · $1,200+197.87%
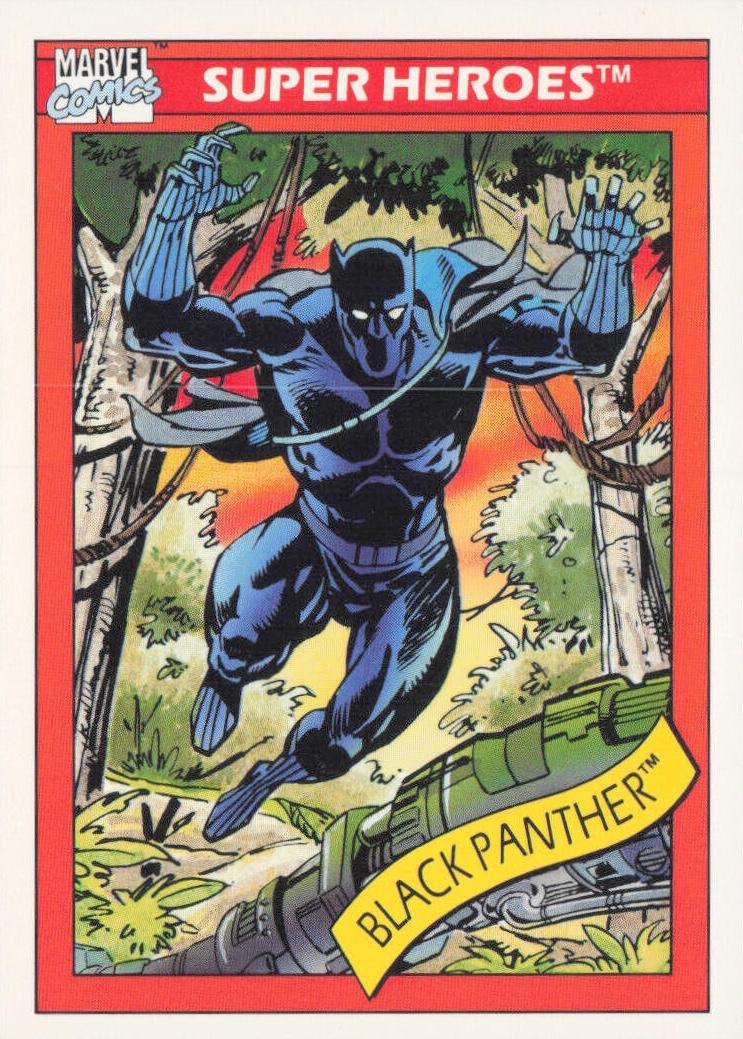 1990 Black Panther PSA 10Universe · $275+192.49%
 1992 Shadowcat PSA 10Masterpieces · $211+180.70%
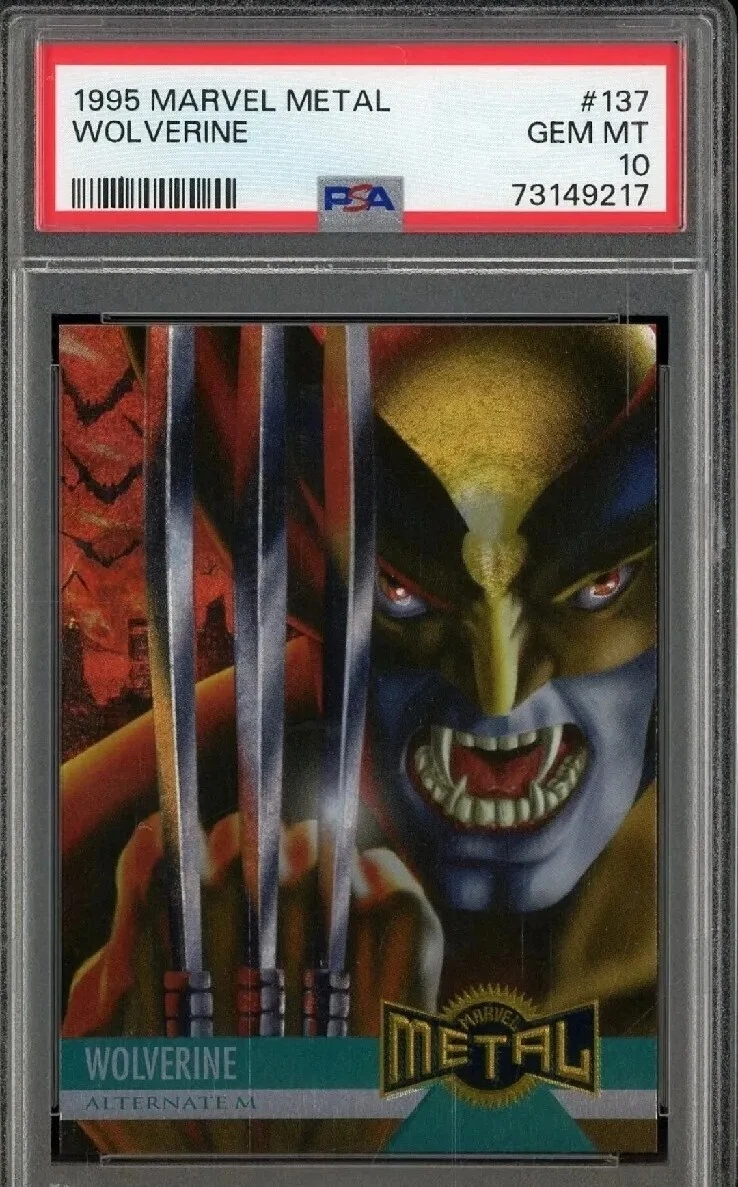 1995 Wolverine [Silver Flasher] PSA 10Marvel Metal · $193-70.77%
 1995 Hulk PSA 10Metal · $99-65.96%
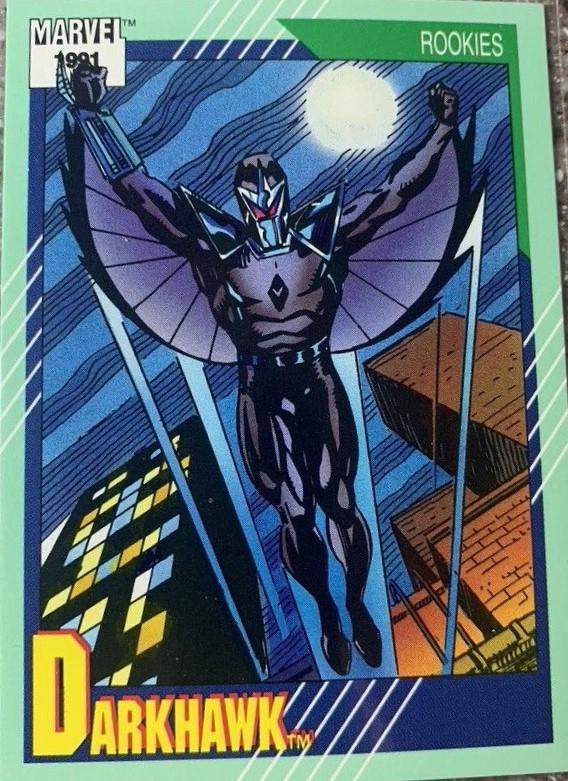 1991 Darkhawk PSA 10Universe · $165-62.12%2025 Storm PSA 10Topps Chrome Marvel · $41-60.76%
 1992 Mandarin PSA 10Masterpieces · $220-51.22%
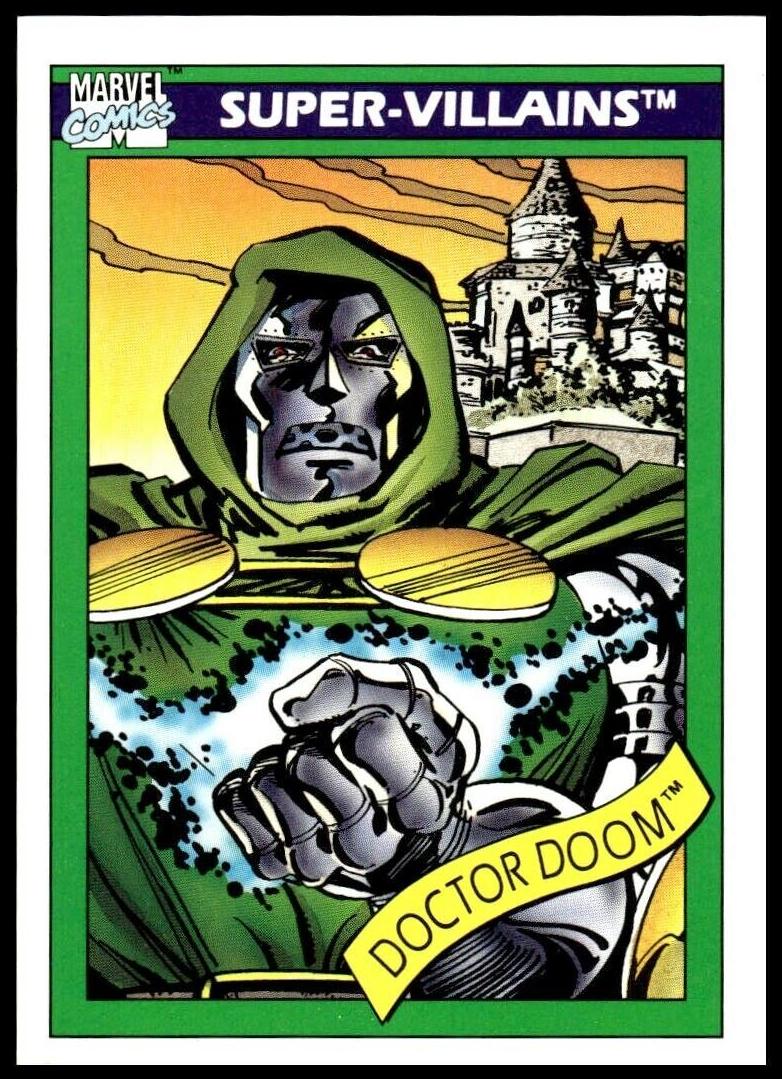 1990 Dr. Doom PSA 10Impel Marvel Universe · $244-47.71%
 1992 Black Panther PSA 10Masterpieces · $275-45.00%
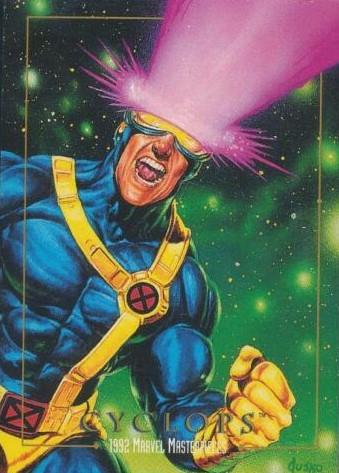 1992 Cyclops PSA 10Masterpieces · $200-43.87%
 2025 Wolverine PSA 10Topps Chrome X-Men Giant Size 50th Anniversary · $98-34.66%
 2025 Silver Surfer PSA 10Topps Chrome Galactic Legends · $249-34.17%
Value-weighted index, base 100 at the window start: the sum of the basket's observed values against the prior day's, chained daily, each card's move capped so one outlier can't dominate. Values come from real comparable sales resolved on Slabline card pages. The window deepens automatically as history accumulates. Long-run history reflects the 223 most-traded cards in this basket; the recent window covers all 7,594 tracked cards. Not investment advice.
Track them against this index — live values, a 0–1000 protection score, and a broker-ready insurance schedule. Free.